
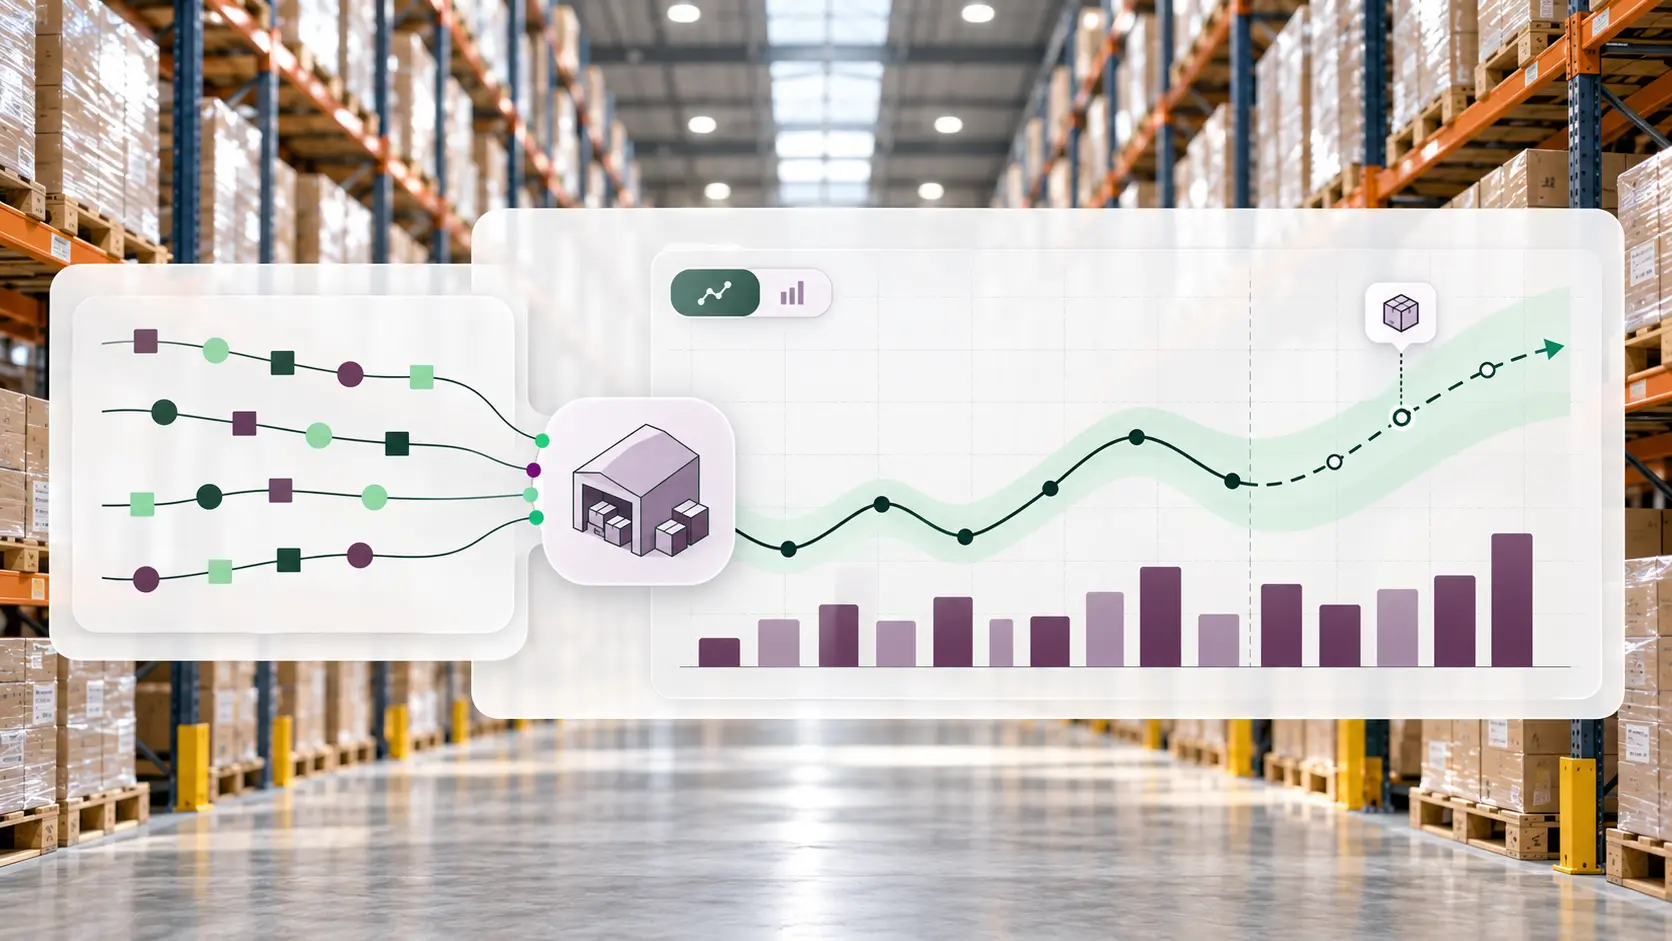
Demand forecasting means estimating how much of each product customers will buy, where, and when. It helps you plan purchasing, inventory, and staffing before orders arrive. With a clearer view of demand, you can position stock closer to customers and prepare your team for busy periods. That means less cash tied up in slow-moving products and fewer missed sales because popular items are out of stock.
But here’s the thing: A forecast is a number. Demand is a behavior. The gap between the two is where most planning errors live. Closing it has less to do with new software than with feeding any model cleaner inputs and measuring exactly where it misses.
This guide covers the definition, the main types and methods, a step-by-step process, and the levers that improve accuracy.
TL;DR
- Demand forecasting predicts customer demand by SKU, channel, and location, using order history, market signals, and planned activity.
- Sales aren’t demand. Stockouts, backorders, and one-off bulk orders distort the record, so raw sales need cleaning before they feed a model.
- Two method families: quantitative (moving averages, exponential smoothing, regression, machine learning) and qualitative (Delphi panels, sales force input, market research).
- Track error and bias. A forecast can look accurate while consistently over-ordering.
- Data beats models. Real-time inventory, quickly reconciled returns, and clean order data improve every method.
- Put your data to work with NovEx. We help turn order history and inventory data into clear replenishment and stock allocation decisions. Talk to our team about your inventory needs.
Demand Forecasting Definition and Meaning
A working demand forecasting definition: the process of predicting future customer demand for a product over a defined time horizon, using historical data, market inputs, and known business activity.
In operational terms, demand forecasting comes down to three questions: what will customers order, how much, and when. Supply chain teams add a fourth: where. A forecast that is accurate nationally but wrong by region still leaves one warehouse short while another holds excess stock.
Demand Analysis and Forecasting: How They Differ
Demand analysis and forecasting are often grouped together, but they serve different purposes. Demand analysis looks backward to explain why volume moved: a price change, a promotion, a competitor stockout, a heat wave, a new retail account. Forecasting looks forward and uses those explanations to project volume. Analysis without forecasting produces insight nobody acts on. Forecasting without analysis produces numbers nobody can defend.
📌 Expert’s tip: If a SKU sold 400 units in a month but was out of stock for nine days, true demand was higher than 400. Forecasting from raw sales bakes that stockout into next month’s plan.
What Is Demand Forecasting in Supply Chain Management?
In the supply chain, the forecast drives almost every downstream decision: purchase orders, inbound receiving schedules, warehouse labor, safety stock, and how inventory is split across fulfillment nodes.
The stakes are large. IHL Group research reported by Chain Store Age puts the cost of inventory distortion (out-of-stocks plus overstocks) at $1.73 trillion a year for global retail, roughly 6.5% of sales.
Forecast errors also compound as they move upstream. This is the bullwhip effect: small swings in customer orders grow into larger swings in orders and inventory at each tier above. Research from ETH Zurich found inventory fluctuations rose significantly as forecast error increased.
At the warehouse level, forecast quality shows up across your inventory management process and in metrics like days sales in inventory. An inflated forecast pushes DSI up and leaves units to age. A low one drains safety stock and triggers expedited freight. Chronic over-forecasting is one of the most common sources of aged inventory.
Types of Demand Forecasting
Most teams run more than one type at once: a short-term, micro-level forecast to set weekly replenishment by SKU and fulfillment center, and a long-term, macro-level view to decide whether a second warehouse is needed.
Type | Typical horizon | Primary use |
|---|---|---|
Short-term | Up to 12 months | Replenishment, labor scheduling, promotions |
Long-term | 1-5 years | Capacity, network design, new markets |
Macro-level | Varies | Economic conditions, category demand, consumer trends |
Micro-level | Varies | A specific SKU, region, channel, or customer segment |
Passive | Short to medium | Stable products where history is a reliable guide |
Active | Short to medium | Growing brands, launches, heavy promotional calendars |
Demand Forecasting and Its Methods
Forecasting methods split into two families. Quantitative methods use numerical history. Qualitative methods use structured judgment. Mature planning teams combine both: statistics for the baseline, judgment for what history can’t see.
Quantitative Methods
Method | How it works | Best for | Watch out for |
|---|---|---|---|
Moving average | Averages demand over a trailing window | Stable, low-variability SKUs | Lags behind trend changes |
Exponential smoothing | Weights recent periods more heavily; Holt-Winters adds trend and seasonality | Short-term replenishment | Smoothing constant needs tuning |
Models trend, seasonality, and autocorrelation | SKUs with 2+ years of clean history | Ignores external drivers | |
Regression | Links demand to price, promotions, ad spend, or weather | Promotion-heavy or weather-sensitive lines | Drivers must be forecast too |
Machine learning | Learns non-linear patterns across many SKUs and inputs | Large catalogs with rich data | Scales bad inputs as fast as good ones |
For exponential smoothing, the NIST Engineering Statistics Handbook explains how the smoothing constant is typically chosen: test values against history and keep the one that minimizes squared error.
Qualitative Methods
Method | How it works | Best for | Watch out for |
Experts submit anonymous estimates over several rounds, refining them after reviewing group feedback | Products or markets with limited historical data | Takes time; expert agreement does not guarantee accuracy | |
Sales force composite | Account reps estimate demand for their customers, then combine forecasts | B2B businesses where a few accounts drive most volume | Sales quotas can lead to overly optimistic estimates |
Market research | Surveys, interviews, and focus groups assess purchase intent | Product launches and new markets with no sales history | Stated interest may not translate into purchases |
External Signals Worth Adding
Leading indicators help a business decision maker react before actual sales do. Public series such as advance retail sales data from the St. Louis Fed track category-level spending shifts, and NOAA’s month-to-season outlooks flag temperature and precipitation anomalies that move seasonal categories like apparel, beverages, and outdoor goods.
How to Do Demand Forecasting: A 6-Step Process
The short answer to how do you forecast demand is that the process around the method matters more than the method itself. These steps apply whether you work in a spreadsheet or a planning platform.
- Define the decision. Name what the forecast drives (PO quantities, labor, inventory allocation by node), plus the level (SKU, family, channel) and horizon. A forecast for purchasing against a 90-day supplier lead time looks different from one for weekly labor planning.
- Clean the data. Pull order history at the most granular level available, then flag stockout periods, one-time bulk orders, and returns. Replace stockout-depressed periods with estimated demand.
- Segment SKUs. Classify by value (ABC) and variability (XYZ). Stable, high-value items suit statistical models. Erratic, low-volume items often need simple reorder rules and a buffer instead of more modeling.
- Test against a holdout. Hold back the most recent periods, run several methods on the older data, and compare their errors. Keep the simplest method that performs within a few points of the best.
- Layer in events. Add promotions, price changes, new retail accounts, and launches on top of the statistical baseline, and document each adjustment for later review.
- Measure and adjust. Compare forecast to actual every cycle, track error and bias by segment, and update assumptions in a regular cross-functional review.
Keeping this process running takes time and consistent attention. NovEx can help you turn order history and inventory data into practical decisions: what to reorder, how much to hold, and where to place stock. We work alongside your team to adjust the plan as demand changes.
How to Improve Demand Forecasting Accuracy
Teams working on how to improve demand forecasting accuracy usually start with the model. The bigger gains tend to sit upstream and downstream of it. Models matter. Inputs matter more.
Measure Error and Bias Together
Mean absolute percentage error (MAPE) shows how far off a forecast was. Bias shows which direction. Let’s analyze a one-month example across three SKUs:
SKU | Forecast | Actual | Absolute error | Error % |
|---|---|---|---|---|
A | 1,000 | 900 | 100 | 11.1% |
B | 500 | 450 | 50 | 11.1% |
C | 200 | 160 | 40 | 25.0% |
Total | 1,700 | 1,510 | 190 | 12.6% |
MAPE averages the three error percentages: 15.7%. Weighted MAPE (WMAPE) divides total absolute error by total actual demand: 190 ÷ 1,510 = 12.6%. Bias is (1,700 − 1,510) ÷ 1,510 = +12.6%. When WMAPE and bias match, every error points the same way. That is a systematic over-forecast, not noise, and excess inventory is building on every SKU.
➡️ WMAPE = sum of absolute errors ÷ sum of actual demand. Bias = (total forecast − total actual) ÷ total actual.
Rebuild Demand From Censored Sales
When a SKU stocks out, recorded sales understate demand. Estimate lost demand for stockout days using the pre-stockout daily run rate, and record backorders on the date they were placed, not the date they shipped.
Forecast at the Right Level
Error shrinks with aggregation. Forecast at the product-family or national level where volume is stable, then split down to SKU and location using recent mix. For slow-selling items with unpredictable demand, a clear reorder point and enough safety stock to cover unexpected orders can work better than a complex forecast.
Size Safety Stock From Measured Error
Safety stock should reflect the forecast error you actually observe, not a flat number of weeks of cover. High-error SKUs carry more buffer; reliably forecast SKUs carry less, which frees cash. For expiry-dated goods, pair this with FEFO rotation so buffer stock doesn’t expire on the shelf.
Shorten the Data Lag
A forecast is only as current as the inventory data behind it. If receipts take days to post, or returned units sit unprocessed, the plan is built on positions that no longer exist. Real-time inventory visibility and fast returns reconciliation close the gap between what the system shows and what is on the shelf.
💡 Run a bias check before changing the model. If a SKU family has been over-forecast for three straight cycles, correct the baseline first; a new algorithm will inherit the same skewed inputs.
Break Down Planning Silos
Sales knows about the new retail account. Marketing knows about the promotion. Operations knows about the delayed inbound container. Without a shared monthly review, the forecast misses all three. Regular, brief reviews where each team checks and agrees on forecast assumptions help catch major gaps before they lead to stockouts or excess inventory.
Turn Cleaner Inventory Data Into Better Forecasts
Every forecasting method depends on knowing what was actually ordered, shipped, returned, and sitting on the shelf. At NovEx, our custom WMS gives you real-time visibility into inventory across our bicoastal fulfillment centers in Salt Lake City and Memphis, backed by 99.8% order accuracy.
With warehouse inventory management and control, lot control with FIFO, LIFO, and FEFO rotation, and omnichannel fulfillment running through one system, your planning team works from clean data instead of reconciling spreadsheets.
Frequently Asked Questions
What is demand forecasting in simple terms?
Demand forecasting is estimating how many units of each product customers will buy in a future period. Businesses use that estimate to decide how much inventory to purchase, where to store it, and how much labor to schedule.
How do you forecast demand for a new product with no sales history?
Borrow history from a comparable product, often called forecasting by analogy, and adjust for price and distribution differences. Add market research or a Delphi panel, then switch to statistical methods once eight to twelve weeks of sales exist.
What is a good demand forecast accuracy?
It depends on the product and the level of forecast. A practical test: compare your forecast with a simple baseline, such as last month’s sales. If that baseline produces 30% WMAPE and your forecast produces 22%, your process improves accuracy.
What is the fastest way to improve demand forecasting accuracy?
Clean the input data before changing the model. Remove one-off bulk orders, replace stockout periods with estimated demand, and post receipts and returns promptly. Then track bias monthly, since consistent over- or under-forecasting is the easiest error to fix.
How often should demand forecasts be updated?
Most teams refresh short-term forecasts weekly or monthly, aligned to their replenishment cycle, and revisit long-term forecasts quarterly. Update immediately after major events such as a new retail account, a price change, or a supply disruption.